
If every app gets its own PostgreSQL database, a server with a few hundred apps holds a few hundred databases. Is that wasteful? A database is not a process or a server: it is a folder of files and a row in a shared catalog, so the cost is mostly disk. But not only disk, and the rest is easy to miss. We created 100 empty databases on PostgreSQL 18 three times and measured what each one adds.
Short version: an empty database takes 7.43 MiB on disk in 300 files and writes 4.46 MB of WAL to create. It costs no process memory and no CPU until something connects to it. Once an app has connected, autovacuum visits it every minute (about 6 ms of CPU each time) and its system catalogs take about 0.8 MiB of shared_buffers. With the default STRATEGY WAL_LOG, creating one takes 14 ms; the old FILE_COPY takes 95 ms and forces two checkpoints.
How we measured
We ran the official postgres:18 image (PostgreSQL 18.6) with default settings, started a fresh cluster with initdb inside the container so we could stop and start the server ourselves, and created 100 databases from template1, first with STRATEGY WAL_LOG and then, after dropping them, with STRATEGY FILE_COPY. Each full run used a new container and ran 3 times; the tables show medians, and disk and catalog sizes were the same to the byte in all 3 runs.
Disk: 7.43 MiB and 300 files per database
CREATE DATABASE copies the template, and template1 on a fresh PostgreSQL 18 cluster holds the system catalogs: about 300 files for tables like pg_class and pg_attribute, their indexes, free space maps and visibility maps. Every new database gets its own copy:
| Data directory | Fresh cluster (3 databases) | 103 databases | Per extra database |
|---|---|---|---|
| base/ (all databases) | 22,600 kB | 783,232 kB | 7,606 kB (7.43 MiB) |
| files in base/ | 900 | 30,901 | 300 |
| pg_database_size() | 7,774,735 bytes | 7.41 MiB | |
| global/ (shared catalogs) | 528 kB | 572 kB | 0.44 kB |
| pg_wal/ | 16,396 kB | 458,764 kB | see the next section |
| whole data directory | 39,700 kB | 1,242,744 kB |
Two small additions come later. The first connection to a database writes a relation cache file, pg_internal.init, of 160,944 bytes, so a database an app has used is about 7.59 MiB. And FILE_COPY copies that file from template1 along with everything else, so its databases start at the same 7.59 MiB.
The shared part barely moves. pg_database holds one row per database: 80 kB with 3 databases, 96 kB with 103. Adding one login role per database, the usual setup for per-app databases, took pg_authid from 72 to 96 kB and pg_shdepend (which records who owns what) from 16 to 40 kB. Creating the 100 roles, making each the owner of its database and revoking PUBLIC access took 186 ms in total and wrote 183 kB of WAL.
So the disk budget is close to linear and easy to plan: 100 empty databases are 743 MiB, 1,000 are 7.3 GiB, 10,000 are 73 GiB, before any app writes a row. Dropping one took 5.3 ms and gave back all of it.
WAL_LOG or FILE_COPY
PostgreSQL 15 added a second way to copy the template and made it the default. WAL_LOG copies the template block by block and writes every block to the write-ahead log; FILE_COPY, the only method before 15, copies the files directly, writes one small WAL record, and forces a checkpoint before and after. The documentation says WAL_LOG is the most efficient when the template is small. Measured on the same server:
| 100 databases from template1 (7.4 MiB) | Median per database | 90th percentile | 100 databases, total | WAL written | Checkpoints |
|---|---|---|---|---|---|
| STRATEGY WAL_LOG (default) | 13.8 ms | 23.9 ms | 1.8 to 2.0 s | 446.3 MB (4.46 MB each) | 0 |
| STRATEGY FILE_COPY | 95.0 ms | 103.4 ms | 9.6 to 10.1 s | 1.2 MB (12 kB each) | 200 |
WAL_LOG was 7 times faster for an empty template, at the price of writing a full copy of the template into the WAL. That WAL is not free either: it went to pg_wal/, which grew from 16 MB to 448 MB and stays that size until checkpoints recycle it (the default max_wal_size is 1 GB), and every replica and WAL archive receives it too. Creating 100 databases sends 446 MB to each standby.
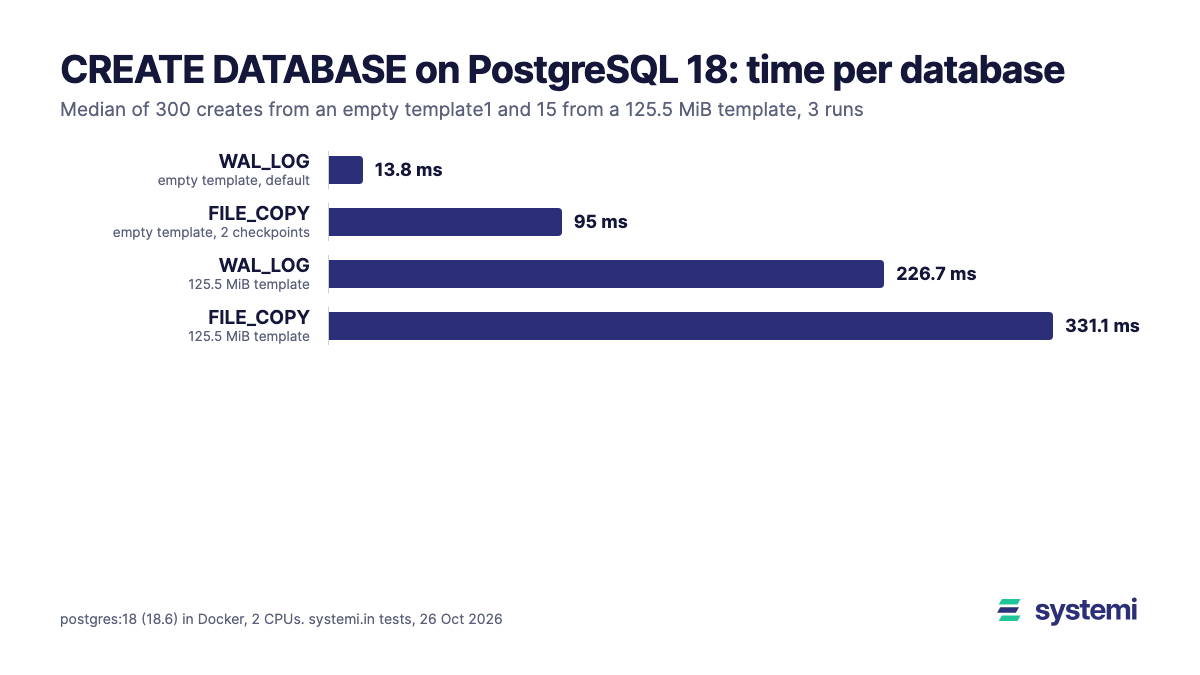
The cover chart shows the other half. We built a 125.5 MiB template (one table of a million rows and an index) and copied it 5 times each way:
| 5 copies of a 125.5 MiB template | Median per database | Total per run | WAL written | Checkpoints |
|---|---|---|---|---|
| STRATEGY WAL_LOG | 226.7 ms | 1.07 to 1.17 s | 631 MB (126 MB each) | 1 (triggered by WAL volume) |
| STRATEGY FILE_COPY | 331.1 ms | 0.79 to 2.14 s | 59 kB | 10 |
With a large template the times came close and FILE_COPY varied the most from run to run (147 to 525 ms per database), because its cost is mostly the two checkpoints, and a checkpoint takes as long as the dirty data waiting to be flushed. On a busy server that is your apps' data, not the new database's. What FILE_COPY really saves is WAL: 59 kB instead of 631 MB. Our reading: keep the default for empty or small templates; use FILE_COPY when you clone large databases and the WAL volume would hurt replicas or archive storage, and avoid it at busy times.
Memory: nothing until an app connects
A database has no process of its own. With 100 extra databases, the server still ran the same 9 processes, the shared memory PostgreSQL allocates at start stayed at 157,040,640 bytes, and process-private memory (Pss_Anon over all postgres processes) stayed at about 5 MiB. Stats for databases live in a fixed 308 KiB area (Shared Memory Stats in pg_shmem_allocations), which 100 databases did not outgrow.
Connecting changes that. A new connection reads its database's system catalogs, and those pages go into shared_buffers, the cache shared by all databases. We connected once to each of the 100 databases and read pg_buffercache:
| After | Buffers holding the 100 app databases' pages | Per database | Share of 128 MB shared_buffers |
|---|---|---|---|
one SELECT 1 per database | 10,100 x 8 kB = 78.9 MiB | 101 buffers, 0.79 MiB | 62% |
| 2 more minutes of autovacuum | 10,669 x 8 kB = 83.4 MiB | about 106 buffers, 0.83 MiB | 65% |
This is cache, not a leak: the pages can be evicted when real data needs room. But with the default shared_buffers of 128 MB, about 150 active empty databases are enough to fill the cache with catalog pages, and they compete with your data from then on. Per-app databases want a larger shared_buffers than one database of the same total size; budget about 0.8 MiB of it per active database. Each connection then costs what it costs in any database, which we measured in How much memory does a PostgreSQL connection use?: 1.56 MiB idle, 3.4 MiB once it has read 100 tables.
Autovacuum: one visit per database per minute
The autovacuum launcher tries to visit every database once per autovacuum_naptime (1 minute by default), spacing the visits evenly: with 100 databases it starts a worker every 0.6 seconds. The worker connects, checks every table's statistics, vacuums or analyzes what needs it, and exits. In the PostgreSQL 18 source (autovacuum.c), the launcher skips databases with no statistics entry, that is, databases nobody has connected to. We counted visits and CPU over 3 idle minutes:
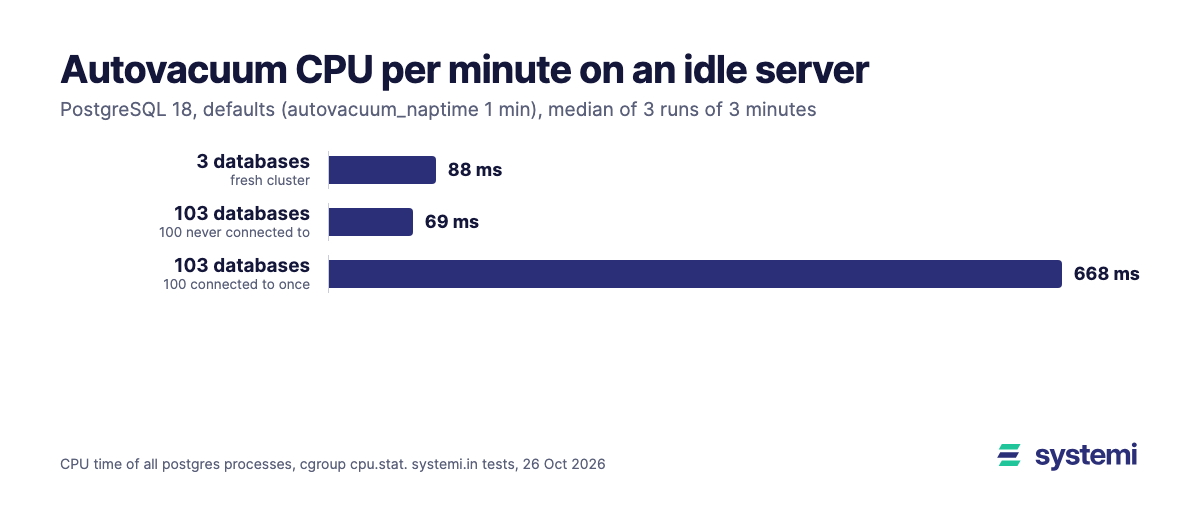
| Idle server | Autovacuum visits in 3 minutes | CPU in 3 minutes | Share of one core |
|---|---|---|---|
| 3 databases (fresh cluster) | 5 | 265 ms | 0.15% |
| 103 databases, 100 never connected to | 6 | 207 ms | 0.11% |
| 103 databases, each connected to once | 281 | 2,003 ms | 1.1% |
That works out to about 6.3 ms of CPU per visit to an empty database ((2,003 - 265) ms / (281 - 5) visits). The launcher also has a floor: it never starts workers less than 110 ms apart (MIN_AUTOVAC_SLEEPTIME of 100 ms, times 1.1). From 600 active databases on, a minute divided by the number of databases is 100 ms or less, so the launcher starts a worker every 110 ms and each database simply waits longer for its turn. From our per-visit figure:
| Active databases | Time between worker starts | Each database visited every | Autovacuum CPU on an idle server |
|---|---|---|---|
| 100 | 0.6 s | 1 minute | 1.1% of a core |
| 500 | 0.12 s | 1 minute | 5.2% of a core |
| 1,000 | 0.11 s (floor) | 110 s | 5.7% of a core |
| 10,000 | 0.11 s (floor) | 18 minutes | 5.7% of a core |
The rows above 100 are arithmetic from our measured 6.3 ms per visit, not runs of their own; a database with real tables takes longer per visit. Two things follow. The idle CPU cost tops out at roughly 6% of one core however many databases you add. And past a few hundred busy databases, a database that needs vacuuming may wait minutes for its turn, so watch pg_stat_user_tables.last_autovacuum and dead tuples, and raise autovacuum_max_workers (3 by default, up to autovacuum_worker_slots, 16) before you lower autovacuum_naptime.
Startup and first connections
| Measured | 3 databases | 103 databases |
|---|---|---|
pg_ctl start until it accepts connections | 105 ms | 122 ms |
first psql -c 'select 1' to a new database | 11 ms | |
| second connection to it | 10 ms | |
| DROP DATABASE, median | 5.3 ms |
A clean start with 100 more databases took 17 ms longer, and the first connection to a new database, which builds its relation cache file, was 1 ms slower than the next. Neither is worth planning around. Crash recovery and backups scale with data and WAL, not with the number of databases, although a pg_dumpall or a per-database pg_dump loop runs once per database.
What 100 databases cost, in one table
| Cost | Per empty database | 100 databases |
|---|---|---|
| disk | 7.43 MiB, 300 files (7.59 MiB after the first connection) | 743 MiB |
| WAL to create (WAL_LOG) | 4.46 MB | 446 MB, also sent to every replica |
| time to create (WAL_LOG / FILE_COPY) | 13.8 ms / 95 ms | 1.9 s / 10.0 s |
| shared catalogs | under 1 kB | 16 kB in pg_database, 64 kB with one role each |
| process memory | none | none |
| shared_buffers once connected | about 0.8 MiB | about 83 MiB |
| autovacuum once connected | 6.3 ms CPU per minute | 1.1% of a core |
Compared with the alternatives, that is cheap. A schema per tenant in one database saves the 7.4 MiB of catalogs per tenant and the autovacuum visits, but every tenant then shares one set of permissions, one search_path to get right on every query and one database-wide backup and restore. A database per app gives each app its own owner role, its own pg_dump, its own DROP DATABASE and a connection limit of its own, for the price of a few MiB of disk. One thing to know before you choose it: connection poolers pool per database and user (PgBouncer's default_pool_size is per user/database pair), so 100 databases means 100 small pools, not one big one.
Checklist for many databases
- Keep
template1small and create app databases from it with the defaultSTRATEGY WAL_LOG: 14 ms each. - Use
STRATEGY FILE_COPYonly to clone large databases when WAL volume matters, and not at busy times: it checkpoints twice. - Budget 7.5 MiB of disk per empty database and 4.5 MB of WAL per create on replicas and in WAL archives.
- Give each database its own login role, make it the owner and
REVOKE ALL ON DATABASE ... FROM PUBLIC, so apps can't connect to each other's databases. - Set a connection limit per role (
CREATE ROLE ... CONNECTION LIMIT n) and keep app pools small. - Size
shared_bufferswith about 0.8 MiB per active database on top of what your data needs. - Past a few hundred active databases, watch
last_autovacuumand raiseautovacuum_max_workers. - Drop the databases of deleted apps: 5 ms gives back the whole 7.4 MiB.
One database per app on systemi
This is how systemi works: every app gets a PostgreSQL 18 database created from template1 with its own database user, which can reach only that database and has a set number of connections. An empty database doesn't count towards your plan's storage; only your tables and data do (Usage and limits).
Sources: our own tests on 26 October 2026 (3 runs, scripts and raw output kept with the article's change request); PostgreSQL 18 documentation, CREATE DATABASE (STRATEGY, WAL_LOG default, FILE_COPY checkpoints) and Automatic Vacuuming (autovacuum_naptime 1 min, autovacuum_max_workers 3, autovacuum_worker_slots 16); PostgreSQL 15 release notes (13 October 2022: WAL-logged database creation becomes the default); PostgreSQL source, src/backend/postmaster/autovacuum.c on REL_18_STABLE (databases without a stats entry are skipped, MIN_AUTOVAC_SLEEPTIME 100 ms); PgBouncer configuration (default_pool_size per user/database pair).
systemi gives every app its own container and its own PostgreSQL database, with the connection string ready in the console.
Read the databases guide