
Sooner or later an app gets a request that takes minutes: a report export, a slow query, a big import. It works on your laptop, then it fails in production, and the error comes from a layer you didn't write. We sent a request that takes 30, 60 and 120 seconds to the same small app in Python, PHP, Java, Spring Boot and .NET, first directly, then through nginx with default settings, then through nginx with a raised timeout, and recorded the status, the time and whether the work finished.
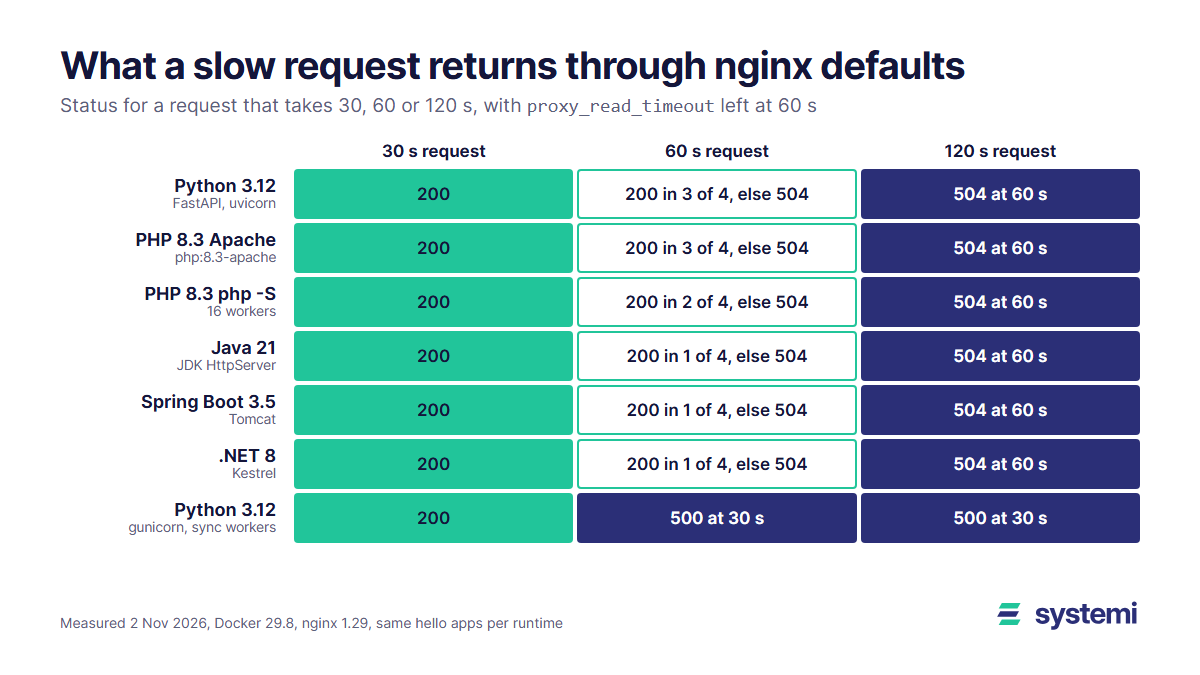
Short version: without a proxy, every runtime we tried answered a 120 s request with 200, except Python under gunicorn's default sync workers, which killed the worker at 30 s and returned 500. Through default nginx, 30 s was fine everywhere, 120 s was a 504 at exactly 60 s, and 60 s was a coin flip: 11 of 24 tries succeeded. After the 504 the app kept working and finished for nobody. PHP's max_execution_time ignored 120 s of waiting but killed 60 s of CPU work at 30 s, and without a php.ini it did that with a 200 status. Moving the export to a PostgreSQL job table turned it into a 27.5 ms request plus a few fast polls, through the same default nginx.
How we measured
The apps are the ones from our redeploy test with two changes: each handler logs a done line when it finishes, so we can see work that outlives its request, and PHP and Python got a CPU-bound endpoint. GET /work?ms=N waits N milliseconds without using CPU and stands in for a slow query. GET /burn?ms=N keeps one CPU busy and stands in for building a report inside the app.
One run per combination is enough for most cells because these are timers: the same limit fired within a second each time it fired. The 60 s case is the exception, which is why it got 4 tries, and even those are too few to rank runtimes against each other.
Direct, default nginx and a 300 s timeout, side by side
Each cell shows the result for the 30, 60 and 120 s request, in that order.
| Runtime | Direct to the app | nginx defaults (60 s) | nginx, proxy_read_timeout 300s |
|---|---|---|---|
| Python, uvicorn | 200 / 200 / 200 | 200 / 3 of 4 / 504 at 60.0 s | 200 / 200 / 200 |
| Python, gunicorn sync | 200 / 500 at 30.1 s / 500 at 30.1 s | 200 / 500 at 30.6 s / 500 at 30.6 s | 200 / 500 at 30.9 s / 500 at 30.9 s |
| PHP 8.3 Apache | 200 / 200 / 200 | 200 / 3 of 4 / 504 at 60.0 s | 200 / 200 / 200 |
| PHP 8.3 php -S | 200 (at 90.0 s) / 200 / 200 | 200 / 2 of 4 / 504 at 60.0 s | 200 (at 90.0 s) / 200 / 200 |
| Java 21 HttpServer | 200 / 200 / 200 | 200 / 1 of 4 / 504 at 60.0 s | 200 / 200 / 200 |
| Spring Boot 3.5 | 200 / 200 / 200 | 200 / 1 of 4 / 504 at 60.0 s | 200 / 200 / 200 |
| .NET 8 Kestrel | 200 / 200 / 200 | 200 / 1 of 4 / 504 at 60.0 s | 200 / 200 / 200 |
Every 200 came back on time, within 0.1 s of what the request asked for, with one exception: the php -S request explained below. So uvicorn, Apache with PHP, the JDK server, Tomcat and Kestrel put no limit of their own on a request that is only waiting, at least up to 120 s. The limit is the proxy. Raising it fixed everything except gunicorn, whose limit sits behind the proxy and doesn't care what nginx allows.
nginx's error log says plainly who cut the request: upstream timed out (110: Operation timed out) while reading response header from upstream. We counted 10 of those lines in the first nginx round: 4 at 60 s and 6 at 120 s. If you see a 504 and that line, the app isn't down. It's slow, and it's probably still running.
At 60 seconds it's a coin flip
proxy_read_timeout defaults to 60 s, so a request that takes 60 s races the timer. Both outcomes arrived at the same moment, between 60.01 and 60.02 s: some were 200, the rest 504.
| Runtime | 200s in 4 tries |
|---|---|
| Python, uvicorn | 3 |
| PHP 8.3 Apache | 3 |
| PHP 8.3 php -S | 2 |
| Java 21 HttpServer | 1 |
| Spring Boot 3.5 | 1 |
| .NET 8 Kestrel | 1 |
| Total of those six | 11 of 24 |
Don't read this as Python beating .NET: with 4 tries the gaps between runtimes are noise. The useful part is what a user sees. An export that normally takes about a minute works on Monday and fails on Tuesday with nothing changed, which is a much harder bug report than one that always fails. If a request's normal time is anywhere near a timeout, treat it as already broken.
The 504 doesn't stop the work
This is the part that costs money. nginx gives up and closes its connection to the app, but no runtime we tried stopped working. In the nginx round, Python, PHP (both setups), Java, Spring Boot and .NET all logged done for the 60 and 120 s requests, including those that had already answered 504. Python's 120 s request is a clean example: done came exactly 120 s after it started, 60 s after the user got the error.
Now add the user. This part is arithmetic, not a measurement: a 120 s report and someone who clicks again each time they see the error. The first copy starts at 0 s. At 60 s they get a 504 and start a second copy. At 120 s the first copy finishes for nobody, the second one's 504 arrives, and a third starts. From second 60 on, two copies run at all times and no click ever gets a result. Each copy holds a thread or worker and usually a database connection, and connections have their own cost. Retries in a client library or a load balancer do the same thing faster.
Your code can stop early, but only if it checks. .NET gives you HttpContext.RequestAborted to hand to your queries, and Starlette has await request.is_disconnected(). We didn't test either, and neither helps a blocking call that never looks. A PostgreSQL statement_timeout is the blunt version that doesn't depend on your code.
gunicorn's 30 second worker timeout
Gunicorn was the one runtime that failed with no proxy at all, and the only one where 60 s through nginx wasn't a coin flip. Its timeout setting defaults to 30, and a sync worker that stays silent longer gets killed by the master process. The client gets a 500 and the work dies with the worker:
No done line appeared for the 60 or 120 s requests, unlike every other runtime. So gunicorn doesn't waste work after the error, it loses the work. With 4 sync workers, 4 slow requests also block everything else until they're killed.
The gunicorn docs warn against raising this for sync workers unless you're sure of the consequences, and they note that for the other worker types the timeout only means the worker is still communicating, not how long one request may take. So --worker-class gthread --threads 4 or an async worker is the usual way out for requests that wait; we measured only the sync default. FastAPI under uvicorn, the first row of the table, has no such limit.
PHP's max_execution_time counts CPU, not waiting
Most people read max_execution_time = 30 as "a PHP request can last 30 seconds". On Linux, with the default build, it means 30 seconds of CPU, which is a different thing. php.net says the limit isn't affected by system calls and stream operations on non-Windows systems. So we tried both sides of it, directly against the app:
| Setup | Waiting, 120 s (/work) | CPU, 60 s (/burn) |
|---|---|---|
| php:8.3-apache, no php.ini | 200 at 120.0 s | 200 at 30.0 s, body holds the fatal error text |
| php -S, no php.ini | 200 at 120.0 s | 200 at 30.0 s, body holds the fatal error text |
| php:8.3-apache, php.ini-production | 200 at 120.0 s | 500 at 30.0 s, empty body, error in the log |
| For comparison: Python, uvicorn | 200 at 120.0 s | 200 at 60.0 s, no limit |
The first two rows are the trap. The official Docker image ships without a php.ini, so display_errors is on and PHP prints the error into an ordinary 200 response:
An uptime check or an access log sees a success. Copy php.ini-production into your image (cp "$PHP_INI_DIR/php.ini-production" "$PHP_INI_DIR/php.ini") and it becomes an honest 500 with the error in the log and nothing leaked to the user. Two more details. The docs give 0 as the command-line default, but php -S applied 30 in our run, the same as Apache. And php.net notes that builds with --enable-zend-max-execution-timers (the default for thread-safe builds since 8.3) count elapsed time, sleep included, so check which build you run; our images were the non-thread-safe kind.
Separately, php -S delivered the only slow 200 in the table. Our client starts all the requests at once. In 2 of 3 rounds one worker accepted the 60 s and the 30 s connection together (the log shows the same worker accepting twice) and served them one after the other, so the 30 s request answered at 90.0 s despite 16 workers. That's one more reason to keep php -S out of production.
Streaming resets the timer, until it doesn't
nginx's timeout applies between two reads, not to the whole response, so an endpoint that keeps sending can run far longer than 60 s. We tested a 120 s CSV export from the Python app through default nginx, with different gaps between chunks:
| Chunk every | Status | Time | What arrived |
|---|---|---|---|
| 10 s | 200 | 120.1 s | 99 bytes, header + 12 rows, complete |
| 59 s | 200 | 118.0 s | 28 bytes, header + 2 rows, complete |
| 61 s | 200 | 60.0 s | 16 bytes, header only: cut off |
Look at the last row. The header was already sent, so the 200 status was too; when the next chunk took too long, nginx closed the connection and had no way to change the status. Anything checking only the status sees a success, and the file has no rows. Streaming works when each gap is reliably short, such as a row loop over a cursor. It's risky when the slow part comes in one lump, such as the first big aggregate of a report, because then the gap is the whole query. Send a row count or an end marker so the client can tell a finished file from a cut one.
Every timeout on the way, by layer
| Layer | Setting | Default | When it fires |
|---|---|---|---|
| nginx | proxy_read_timeout | 60 s between reads | 504 (measured) |
| nginx | proxy_send_timeout, proxy_connect_timeout | 60 s each | Sending the request to the app, connecting to it. Connect usually can't exceed 75 s |
| nginx with php-fpm | fastcgi_read_timeout | 60 s between reads | The same limit under another name: proxy_read_timeout does nothing for FastCGI (not measured) |
| Cloudflare, proxied | Proxy Read Timeout | 125 s; Enterprise up to 6,000 s | Error 524 |
| PHP | max_execution_time | 30 s; CLI 0 (off) | Fatal error at 30 s of CPU (measured under Apache and php -S) |
| php-fpm | request_terminate_timeout | 0 (off) | Kills the worker when set |
| Apache | Timeout | 300 in the php:8.3-apache image's config; 60 in Apache's docs | Waiting on network I/O. Not reached in our test: 120 s passed |
| gunicorn | timeout | 30 s | Sync worker killed, 500, work lost (measured) |
| uvicorn, Kestrel, Tomcat, JDK HttpServer | None for handler time | No limit | 120 s passed on all four (measured) |
| ASP.NET Core | Request timeouts middleware | Off until you add and configure it | Signals cancellation; 504 if the app produces no response |
The shortest limit wins, and it's usually not the one you were looking at. Behind a CDN, a 300 s nginx setting still ends at 125 s.
The fix: make the request short and let a job do the work
Nothing about a report says it must happen inside an HTTP request. Queue it and answer at once. The queue can be one table in the PostgreSQL you already run, with no extra service. Here is the core of our test app:
POST /exports inserts a row and returns 202 with a status URL. Two worker threads run the claim in a loop, do the work and mark the row done or failed. The browser polls GET /exports/{id} and downloads the file when it's ready. FOR UPDATE SKIP LOCKED is what makes this safe with several workers: a row one worker has locked is skipped by the others instead of waited for. We ran the same 120 s wait that got a 504 before, plus a 1,000,000 row CSV, through nginx with default settings:
| Step | Measured |
|---|---|
POST /exports answers 202 | 27.5 ms |
| Status polls | 58, about one every 2 s, slowest 30.8 ms |
| Job run time (120 s query + CSV) | 120.7 s |
| Client sees it ready | 123.5 s after the POST |
| CSV size | 37,829,316 bytes, 1,000,000 rows |
| Download | 134 ms |
| Timeouts | None, and no timeout setting touched |
The user waits the same two minutes, but on a working page, and clicking again can't start a second copy if you check for a running job first. Two things our small test app skips and a real one needs. A job left in running by a restart stays there, so requeue old ones on startup; since a redeploy stops the container, this will happen. And the CSV in our test sits in the container's /tmp, which goes away with the container, so keep results in the database or in storage outside it.
The SQL is the same on every runtime; only the worker changes. We measured the Python version, and the other rows are the usual way to do the same thing:
| Runtime | Where the worker runs |
|---|---|
| Python | A thread as in our test, or better a separate python worker.py process. Under gunicorn keep it out of the web workers, which get killed and recycled |
| PHP | A CLI script in a loop, php worker.php, as a separate process where max_execution_time defaults to 0. A PHP request has no threads to borrow |
| Java | A ScheduledExecutorService polling with JDBC |
| Spring Boot | @Scheduled with JdbcTemplate running the claim statement |
| .NET | A BackgroundService with Npgsql |
If you must keep it synchronous
Sometimes a job table is more than the problem deserves: an internal admin page used twice a month, say. Then raise the limits for that one path, not the whole site, and set them so the layers end in order: the database stops first, the app next, the proxy last. That way the app gets to report the failure instead of a proxy cutting it off.
We tested only the nginx line of this list: 300 s let every runtime except gunicorn sync through at 120 s. A raised timeout doesn't make the request safe to retry, and it still holds a worker for the whole wait, so a handful of these at once can use up a small pool.
Slow requests are one half of request trouble; the other half is what happens when the container goes away. Our redeploy test covers requests lost while a container is replaced, and the cold start test how long each runtime takes to answer again.
Sources: our measurements of 2 Nov 2026 (apps, scripts and raw results kept with the test); nginx proxy module and FastCGI module (timeouts, 60 s defaults, between two reads or writes); PHP manual, max_execution_time, set_time_limit and FPM configuration; Cloudflare, error 524 (125 s, Enterprise up to 6,000 s); gunicorn settings (timeout, 30 s); Apache httpd core documentation (Timeout) and apache2.conf in the php:8.3-apache image; Microsoft Learn, request timeouts middleware; PostgreSQL 18, SELECT, the locking clause (SKIP LOCKED).
systemi builds and runs Python, Java, .NET, PHP and static apps in their own containers on one platform, with a PostgreSQL database per app and a subdomain.
See how deploys work